

ICHIMOKU KINKO HYO · 一目均衡表
Ichimoku Kinko Hyo
A 13 lesson guide to market equilibrium—from the five lines to a complete chart reading process.
Begin with lesson 01 →Understand what the chart is measuring
Ichimoku combines range midpoints with displaced price comparisons. The aim of this learning path is to help you explain the relationships you see, rather than memorise isolated crosses.
All illustrations are original schematics, not historical charts or performance evidence.
OPTIONAL COMPANION READING
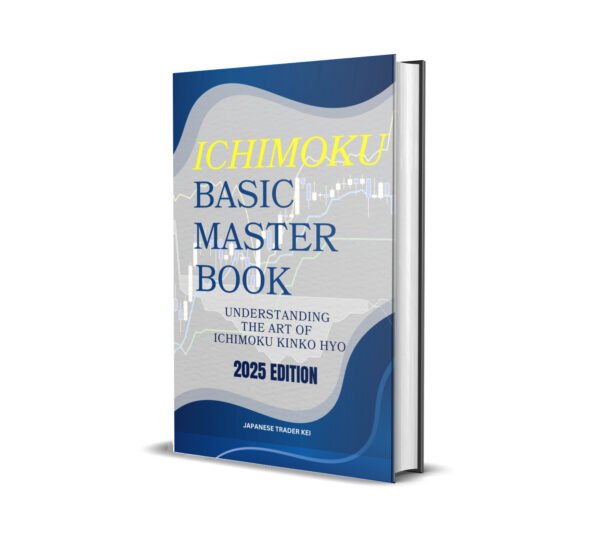
Ichimoku Basic Master Book
If you prefer a book alongside these lessons, Kei’s 2025 Edition explores the five lines, their calculations and interpretation, with real chart examples from 2025. It offers another way to revisit the foundations at your own pace.
Explore the book →YOUR LEARNING PATH
Build your understanding, step by step
01–06: the lines and their meaning. 07–10: reading market conditions. 11–13: the deeper role of midpoints.
The five lines, at a glance
Three signals, one context
What equilibrium actually means
Tenkan and Kijun in practice
Chikou: today viewed in the past
How the cloud is constructed
Reading a sideways market
How trend control develops
A plan for false signals
A repeatable chart reading checklist
The three jobs of a midpoint
Midpoint versus moving average
Important midpoints and turning areas
How to use this series
Read in order, try the observation exercise, and compare the schematic with your own chart. This path focuses on the five line framework and midpoint analysis. Ichimoku’s time, wave and price observation theories extend beyond this introductory series.
The learning topics draw on Kojiro’s Japanese 13 part series; the English explanations, examples and diagrams are original. Each lesson links to its specific reference.
YOUR NEXT STEP
Beyond the five lines
Continue with time theory, wave theory and price observation. Use labelled charts to connect bar counts, swing structure and calculated levels.
Explore Ichimoku Three Theories →Explore related topics

AUTHOR
Kei
Kei is a Japanese forex trader and mentor who has traded since 2013. He teaches Ichimoku in English from the original Japanese texts, with a focus on chart analysis, trading psychology and risk management.
More about Kei →